Generalized Procrustes analysis from TPS file#
import numpy as np
import pandas as pd

import matplotlib.pyplot as plt
import seaborn as sns

from sklearn.decomposition import PCA

from ktch.landmark import GeneralizedProcrustesAnalysis
from ktch.io import read_tps
Reading TPS file#
df_triangles = read_tps("./landmarks_triangle.tps", as_frame=True)
df_triangles
| x | y | ||
|---|---|---|---|
| specimen_id | coord_id | ||
| 0 | 0 | -0.531046 | -0.280265 |
| 1 | -0.177303 | 1.107969 | |
| 2 | 0.850131 | 1.064210 | |
| 1 | 0 | -0.480121 | -0.145592 |
| 1 | -0.172134 | 0.871833 | |
| ... | ... | ... | ... |
| 48 | 1 | -0.153270 | 0.980145 |
| 2 | 0.692266 | 0.797412 | |
| 49 | 0 | 0.286409 | -0.353412 |
| 1 | 0.213187 | 0.819529 | |
| 2 | 0.905297 | 1.175739 |
150 rows × 2 columns
fig, ax = plt.subplots()
sns.scatterplot(
    data = df_triangles,
    x="x",y="y",
    hue="specimen_id", style="coord_id",ax=ax
    )
ax.set_aspect('equal')
ax.legend(loc="upper left", bbox_to_anchor=(1, 1))
<matplotlib.legend.Legend at 0x7f4bbd63a810>

GPA#
gpa = GeneralizedProcrustesAnalysis().set_output(transform="pandas")
df_coords = df_triangles.unstack().swaplevel(1, 0, axis=1).sort_index(axis=1)
df_coords.columns = [dim +"_"+ str(landmark_idx) for landmark_idx,dim in df_coords.columns]
df_coords

df_shapes = gpa.fit_transform(df_coords)
df_shapes
| x_0 | y_0 | x_1 | y_1 | x_2 | y_2 | |
|---|---|---|---|---|---|---|
| specimen_id | ||||||
| 0 | -0.308613 | -0.638885 | -0.182910 | 0.294746 | 0.491523 | 0.344139 |
| 1 | -0.372183 | -0.487429 | -0.196928 | 0.072805 | 0.569111 | 0.414624 |
| 10 | -0.397825 | -0.561788 | -0.035101 | 0.124282 | 0.432926 | 0.437506 |
| 11 | -0.373016 | -0.613275 | -0.047044 | 0.202708 | 0.420060 | 0.410568 |
| 12 | -0.252899 | -0.620448 | -0.273916 | 0.334577 | 0.526814 | 0.285871 |
| 13 | -0.254792 | -0.594593 | -0.302705 | 0.305684 | 0.557497 | 0.288908 |
| 14 | -0.382952 | -0.569840 | 0.082589 | 0.152464 | 0.300364 | 0.417376 |
| 15 | -0.219393 | -0.552444 | -0.364955 | 0.300376 | 0.584348 | 0.252068 |
| 16 | -0.320267 | -0.494096 | -0.293551 | 0.133416 | 0.613818 | 0.360679 |
| 17 | -0.339855 | -0.603090 | -0.181716 | 0.224619 | 0.521571 | 0.378471 |
| 18 | -0.164839 | -0.213845 | -0.460237 | 0.018226 | 0.625077 | 0.195619 |
| 19 | -0.210433 | -0.539583 | -0.379697 | 0.296870 | 0.590129 | 0.242713 |
| 2 | -0.366486 | -0.605645 | -0.106602 | 0.200330 | 0.473088 | 0.405315 |
| 20 | -0.258150 | -0.504268 | -0.364335 | 0.209576 | 0.622485 | 0.294692 |
| 21 | -0.277794 | -0.566510 | -0.306544 | 0.252170 | 0.584337 | 0.314340 |
| 22 | -0.225401 | -0.676491 | -0.160386 | 0.424549 | 0.385786 | 0.251942 |
| 23 | -0.258153 | -0.676369 | -0.146719 | 0.388880 | 0.404872 | 0.287489 |
| 24 | -0.280671 | -0.525416 | -0.330592 | 0.207091 | 0.611263 | 0.318325 |
| 25 | -0.215296 | -0.505604 | -0.397853 | 0.256922 | 0.613148 | 0.248682 |
| 26 | -0.298502 | -0.529983 | -0.307048 | 0.192828 | 0.605550 | 0.337154 |
| 27 | -0.278224 | -0.639372 | -0.222512 | 0.327351 | 0.500736 | 0.312021 |
| 28 | -0.279808 | -0.576080 | -0.296562 | 0.259860 | 0.576370 | 0.316220 |
| 29 | -0.338928 | -0.453639 | -0.273890 | 0.073037 | 0.612818 | 0.380602 |
| 3 | -0.322719 | -0.611769 | -0.202282 | 0.251475 | 0.525002 | 0.360294 |
| 30 | -0.274653 | -0.499217 | -0.349916 | 0.186850 | 0.624569 | 0.312367 |
| 31 | -0.298402 | -0.477670 | -0.329793 | 0.139829 | 0.628195 | 0.337841 |
| 32 | -0.176246 | -0.605878 | -0.325364 | 0.402554 | 0.501610 | 0.203323 |
| 33 | -0.172484 | -0.478247 | -0.435118 | 0.275371 | 0.607602 | 0.202876 |
| 34 | -0.210254 | -0.662374 | -0.213811 | 0.425340 | 0.424065 | 0.237034 |
| 35 | -0.361575 | -0.629273 | -0.000713 | 0.232784 | 0.362288 | 0.396489 |
| 36 | -0.326016 | -0.656912 | -0.093636 | 0.296542 | 0.419652 | 0.360370 |
| 37 | -0.219476 | -0.656608 | -0.228225 | 0.408971 | 0.447701 | 0.247637 |
| 38 | -0.215303 | -0.490933 | -0.405267 | 0.241987 | 0.620570 | 0.248947 |
| 39 | -0.191623 | -0.543638 | -0.385946 | 0.321395 | 0.577570 | 0.222243 |
| 4 | -0.305088 | -0.667007 | -0.110755 | 0.329094 | 0.415843 | 0.337913 |
| 40 | -0.180727 | -0.544012 | -0.389820 | 0.333616 | 0.570547 | 0.210395 |
| 41 | -0.292490 | -0.527475 | -0.315843 | 0.196640 | 0.608334 | 0.330835 |
| 42 | -0.339802 | -0.505129 | -0.257392 | 0.124161 | 0.597194 | 0.380967 |
| 43 | -0.280448 | -0.667827 | -0.154245 | 0.355591 | 0.434693 | 0.312236 |
| 44 | -0.152263 | -0.556959 | -0.384438 | 0.378026 | 0.536701 | 0.178933 |
| 45 | -0.188162 | -0.585891 | -0.348026 | 0.368723 | 0.536188 | 0.217168 |
| 46 | -0.097880 | -0.420235 | -0.481143 | 0.297774 | 0.579024 | 0.122461 |
| 47 | -0.143493 | -0.576295 | -0.363271 | 0.407702 | 0.506765 | 0.168593 |
| 48 | -0.085252 | -0.549410 | -0.377222 | 0.444325 | 0.462474 | 0.105085 |
| 49 | -0.337458 | -0.635395 | -0.130722 | 0.261236 | 0.468180 | 0.374159 |
| 5 | -0.272885 | -0.612977 | -0.265891 | 0.305395 | 0.538776 | 0.307582 |
| 6 | -0.318673 | -0.540378 | -0.273450 | 0.182154 | 0.592124 | 0.358224 |
| 7 | -0.302482 | -0.635783 | -0.197969 | 0.297893 | 0.500451 | 0.337890 |
| 8 | -0.231492 | -0.657091 | -0.223173 | 0.396416 | 0.454665 | 0.260675 |
| 9 | -0.162869 | -0.625502 | -0.292318 | 0.437962 | 0.455187 | 0.187540 |
df_shapes_vis = df_shapes.copy()
df_shapes_vis.columns = pd.MultiIndex.from_tuples([[int(landmark_idx), dim] for dim, landmark_idx in [idx.split("_") for idx in df_shapes_vis.columns]], names=["coord_id","dim"])
df_shapes_vis.sort_index(axis=1, inplace=True)
df_shapes_vis = df_shapes_vis.swaplevel(0,1,axis=1).stack(level=1)
df_shapes_vis
/tmp/ipykernel_2548/3231015902.py:4: FutureWarning: The previous implementation of stack is deprecated and will be removed in a future version of pandas. See the What's New notes for pandas 2.1.0 for details. Specify future_stack=True to adopt the new implementation and silence this warning.
  df_shapes_vis = df_shapes_vis.swaplevel(0,1,axis=1).stack(level=1)
| dim | x | y | |
|---|---|---|---|
| specimen_id | coord_id | ||
| 0 | 0 | -0.308613 | -0.638885 |
| 1 | -0.182910 | 0.294746 | |
| 2 | 0.491523 | 0.344139 | |
| 1 | 0 | -0.372183 | -0.487429 |
| 1 | -0.196928 | 0.072805 | |
| ... | ... | ... | ... |
| 8 | 1 | -0.223173 | 0.396416 |
| 2 | 0.454665 | 0.260675 | |
| 9 | 0 | -0.162869 | -0.625502 |
| 1 | -0.292318 | 0.437962 | |
| 2 | 0.455187 | 0.187540 |
150 rows × 2 columns
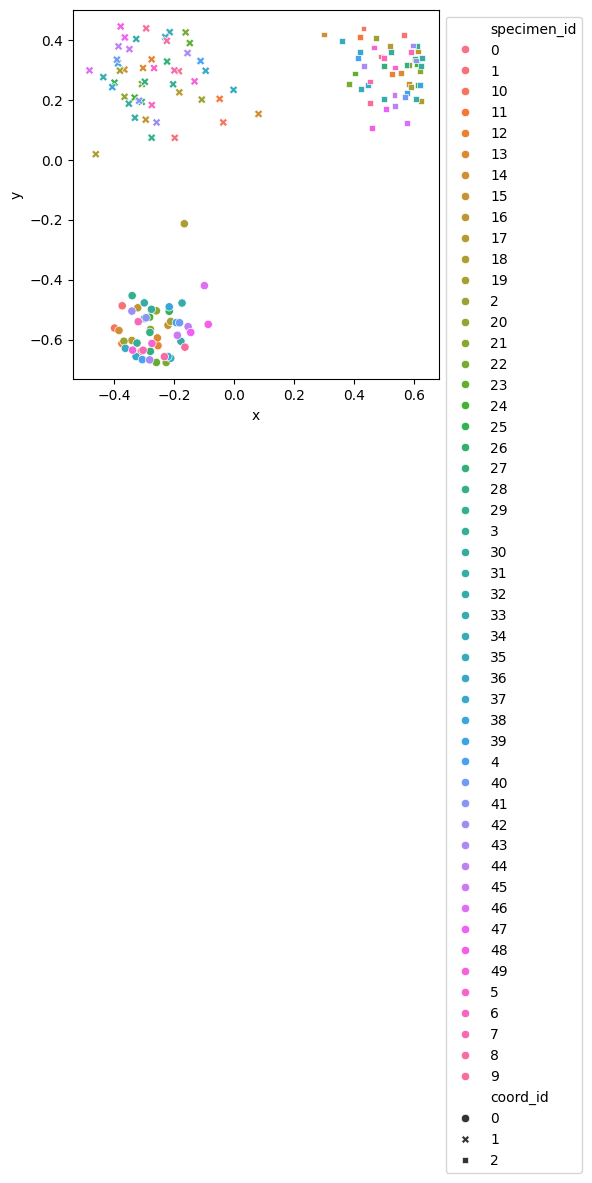
fig, ax = plt.subplots()
sns.scatterplot(
    data = df_shapes_vis,
    x="x",y="y",
    hue="specimen_id", style="coord_id",ax=ax
    )
ax.set_aspect('equal')
ax.legend(loc="upper left", bbox_to_anchor=(1, 1))
<matplotlib.legend.Legend at 0x7f4bba0cf990>