Thin-plate spline#
import matplotlib.pyplot as plt
import seaborn as sns

from ktch.landmark import GeneralizedProcrustesAnalysis
from ktch.plot import tps_grid_2d_plot
from ktch.datasets import load_landmark_mosquito_wings
Load mosquito wing landmark dataset#
from Rohlf and Slice 1990 Syst. Zool.
data_landmark_mosquito_wings = load_landmark_mosquito_wings(as_frame=True)
data_landmark_mosquito_wings.coords
| x | y | ||
|---|---|---|---|
| specimen_id | coord_id | ||
| 1 | 0 | -0.4933 | 0.0130 |
| 1 | -0.0777 | 0.0832 | |
| 2 | 0.2231 | 0.0861 | |
| 3 | 0.2641 | 0.0462 | |
| 4 | 0.2645 | 0.0261 | |
| ... | ... | ... | ... |
| 127 | 13 | -0.2028 | 0.0371 |
| 14 | 0.0490 | 0.0347 | |
| 15 | -0.0422 | 0.0204 | |
| 16 | 0.1004 | -0.0180 | |
| 17 | -0.1473 | -0.0057 |
2286 rows × 2 columns
GPA#
see also :ref:generalized_Procrustes_analysis
X = data_landmark_mosquito_wings.coords.to_numpy().reshape(-1, 18 * 2)
gpa = GeneralizedProcrustesAnalysis(tol=10**-5)
X_aligned = gpa.fit_transform(X)
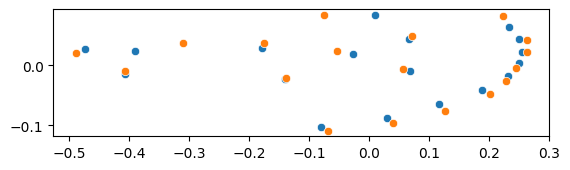
Mean shape and an aligned shape#
X_reference = gpa.mu_  # mean shape
X_target = X_aligned.reshape(-1, 18, 2)[0]  # the 0-th aligned shape
fig = plt.figure()
ax = fig.add_subplot(111)

sns.scatterplot(x=X_reference[:, 0], y=X_reference[:, 1], ax=ax)
sns.scatterplot(x=X_target[:, 0], y=X_target[:, 1], ax=ax)

ax.set_aspect("equal")
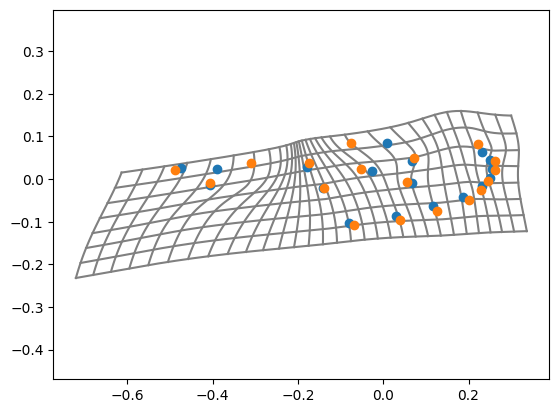
Transformation grids of thin-plate splines#
tps_grid_2d_plot(X_reference, X_target, outer=0.2, grid_size=0.03)
<Axes: >