
Distribution on Morphospace#
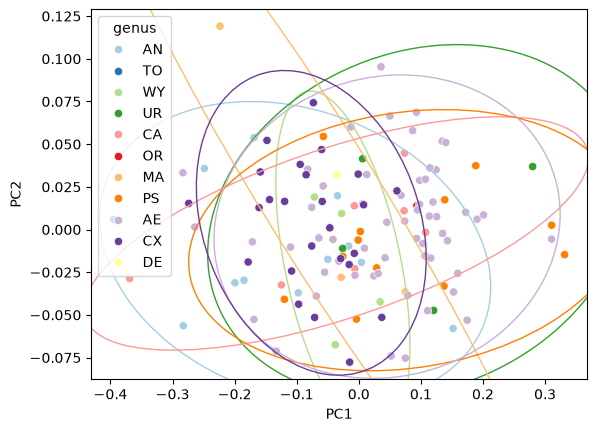
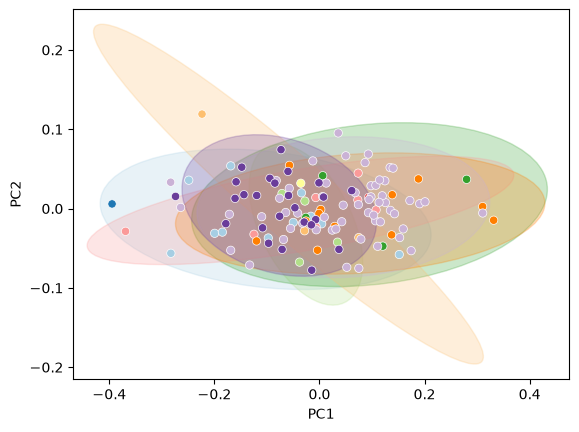
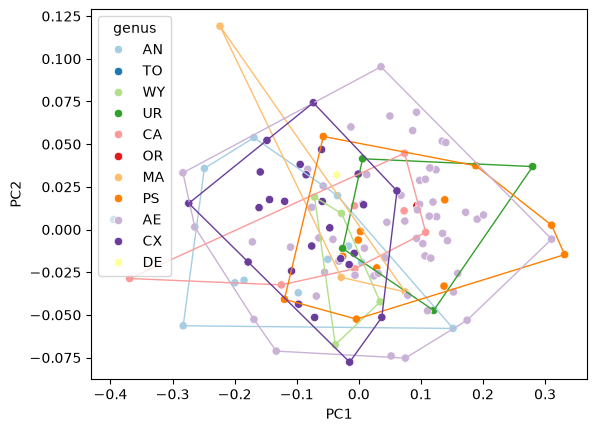
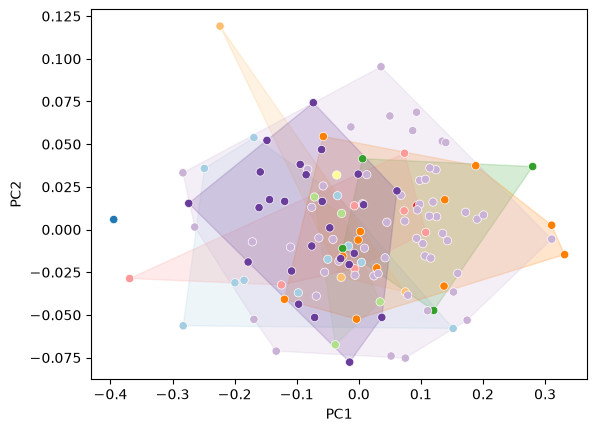
Overlay confidence ellipses and convex hulls on scatter plots to visualize per-group distributions.
Setup#
import numpy as np
import pandas as pd
import matplotlib.pyplot as plt
import seaborn as sns
from sklearn.decomposition import PCA

from ktch.datasets import load_outline_mosquito_wings
from ktch.harmonic import EllipticFourierAnalysis
from ktch.plot import confidence_ellipse_plot, convex_hull_plot, morphospace_plot

data = load_outline_mosquito_wings(as_frame=True)
coords = data.coords.to_numpy().reshape(-1, 100, 2)

efa = EllipticFourierAnalysis(n_harmonics=20)
coef = efa.fit_transform(coords)

pca = PCA(n_components=5)
scores = pca.fit_transform(coef)

df_pca = pd.DataFrame(scores, columns=[f"PC{i + 1}" for i in range(5)])
df_pca.index = data.meta.index
df_pca = df_pca.join(data.meta)
Confidence ellipses#
fig, ax = plt.subplots()
sns.scatterplot(data=df_pca, x="PC1", y="PC2", hue="genus", palette="Paired", ax=ax)
confidence_ellipse_plot(data=df_pca, x="PC1", y="PC2", hue="genus", palette="Paired", ax=ax)
/tmp/ipykernel_2862/375008847.py:3: UserWarning: Category 'TO' skipped: need at least 2 data points for confidence ellipse (got 1)
  confidence_ellipse_plot(data=df_pca, x="PC1", y="PC2", hue="genus", palette="Paired", ax=ax)
/tmp/ipykernel_2862/375008847.py:3: UserWarning: Category 'OR' skipped: need at least 2 data points for confidence ellipse (got 1)
  confidence_ellipse_plot(data=df_pca, x="PC1", y="PC2", hue="genus", palette="Paired", ax=ax)
/tmp/ipykernel_2862/375008847.py:3: UserWarning: Category 'DE' skipped: need at least 2 data points for confidence ellipse (got 1)
  confidence_ellipse_plot(data=df_pca, x="PC1", y="PC2", hue="genus", palette="Paired", ax=ax)
<Axes: xlabel='PC1', ylabel='PC2'>
Change confidence level#
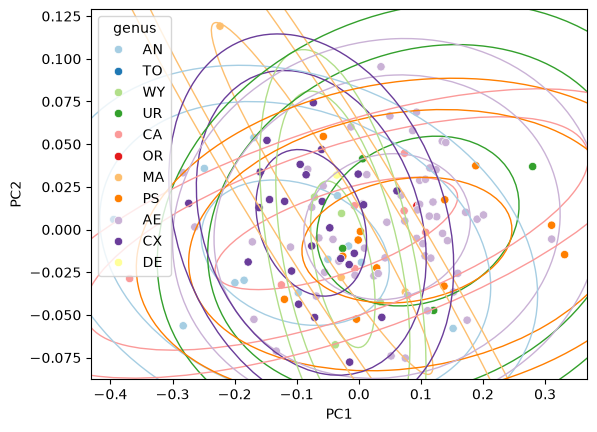
The default is 95 %. Pass confidence to adjust:
fig, ax = plt.subplots()
sns.scatterplot(data=df_pca, x="PC1", y="PC2", hue="genus", palette="Paired", ax=ax)
for conf in [0.5, 0.95, 0.99]:
    confidence_ellipse_plot(
        data=df_pca, x="PC1", y="PC2", hue="genus",
        confidence=conf, palette="Paired", legend=False, ax=ax,
    )
/tmp/ipykernel_2862/3134567655.py:4: UserWarning: Category 'TO' skipped: need at least 2 data points for confidence ellipse (got 1)
  confidence_ellipse_plot(
/tmp/ipykernel_2862/3134567655.py:4: UserWarning: Category 'OR' skipped: need at least 2 data points for confidence ellipse (got 1)
  confidence_ellipse_plot(
/tmp/ipykernel_2862/3134567655.py:4: UserWarning: Category 'DE' skipped: need at least 2 data points for confidence ellipse (got 1)
  confidence_ellipse_plot(
Direct standard-deviation control#
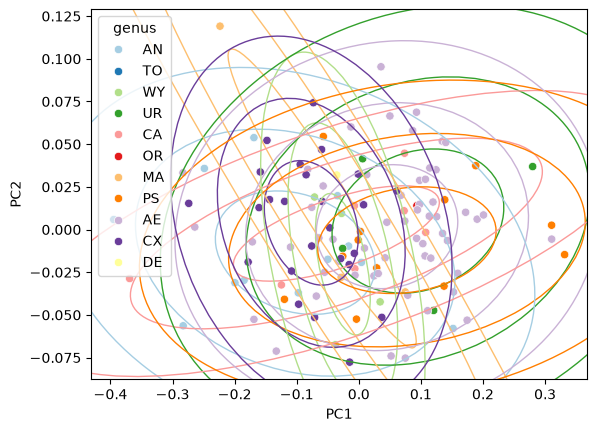
Instead of a confidence level, pass n_std to set the ellipse
radius directly in units of standard deviations:
fig, ax = plt.subplots()
sns.scatterplot(data=df_pca, x="PC1", y="PC2", hue="genus", palette="Paired", ax=ax)
for n in [1.0, 2.0, 3.0]:
    confidence_ellipse_plot(
        data=df_pca, x="PC1", y="PC2", hue="genus",
        n_std=n, palette="Paired", legend=False, ax=ax,
    )
/tmp/ipykernel_2862/1884182781.py:4: UserWarning: Category 'TO' skipped: need at least 2 data points for confidence ellipse (got 1)
  confidence_ellipse_plot(
/tmp/ipykernel_2862/1884182781.py:4: UserWarning: Category 'OR' skipped: need at least 2 data points for confidence ellipse (got 1)
  confidence_ellipse_plot(
/tmp/ipykernel_2862/1884182781.py:4: UserWarning: Category 'DE' skipped: need at least 2 data points for confidence ellipse (got 1)
  confidence_ellipse_plot(
Adjust axis limits#
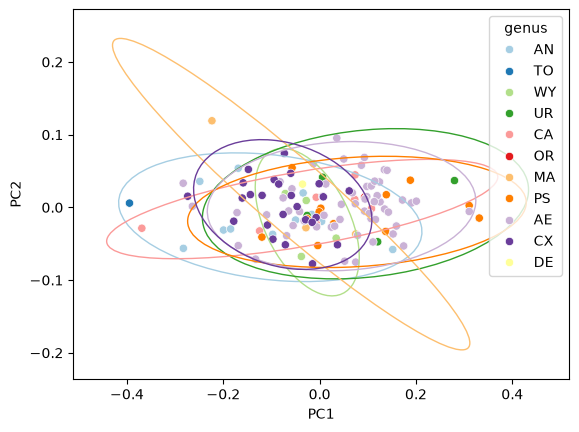
Ellipses may extend beyond the scatter range. Use ax.margins() to
add padding:
fig, ax = plt.subplots()
sns.scatterplot(data=df_pca, x="PC1", y="PC2", hue="genus", palette="Paired", ax=ax)
confidence_ellipse_plot(data=df_pca, x="PC1", y="PC2", hue="genus", palette="Paired", ax=ax)
ax.margins(0.1)
/tmp/ipykernel_2862/2749357594.py:3: UserWarning: Category 'TO' skipped: need at least 2 data points for confidence ellipse (got 1)
  confidence_ellipse_plot(data=df_pca, x="PC1", y="PC2", hue="genus", palette="Paired", ax=ax)
/tmp/ipykernel_2862/2749357594.py:3: UserWarning: Category 'OR' skipped: need at least 2 data points for confidence ellipse (got 1)
  confidence_ellipse_plot(data=df_pca, x="PC1", y="PC2", hue="genus", palette="Paired", ax=ax)
/tmp/ipykernel_2862/2749357594.py:3: UserWarning: Category 'DE' skipped: need at least 2 data points for confidence ellipse (got 1)
  confidence_ellipse_plot(data=df_pca, x="PC1", y="PC2", hue="genus", palette="Paired", ax=ax)
Filled ellipses#
fig, ax = plt.subplots()
confidence_ellipse_plot(
    data=df_pca, x="PC1", y="PC2", hue="genus",
    palette="Paired", fill=True, ax=ax,
)
sns.scatterplot(data=df_pca, x="PC1", y="PC2", hue="genus", palette="Paired", ax=ax, legend=False)
/tmp/ipykernel_2862/1648931896.py:2: UserWarning: Category 'TO' skipped: need at least 2 data points for confidence ellipse (got 1)
  confidence_ellipse_plot(
/tmp/ipykernel_2862/1648931896.py:2: UserWarning: Category 'OR' skipped: need at least 2 data points for confidence ellipse (got 1)
  confidence_ellipse_plot(
/tmp/ipykernel_2862/1648931896.py:2: UserWarning: Category 'DE' skipped: need at least 2 data points for confidence ellipse (got 1)
  confidence_ellipse_plot(
<Axes: xlabel='PC1', ylabel='PC2'>
Convex hulls#
fig, ax = plt.subplots()
sns.scatterplot(data=df_pca, x="PC1", y="PC2", hue="genus", palette="Paired", ax=ax)
convex_hull_plot(data=df_pca, x="PC1", y="PC2", hue="genus", palette="Paired", ax=ax)
/tmp/ipykernel_2862/3980600768.py:3: UserWarning: Category 'TO' skipped: need at least 3 data points for convex hull (got 1)
  convex_hull_plot(data=df_pca, x="PC1", y="PC2", hue="genus", palette="Paired", ax=ax)
/tmp/ipykernel_2862/3980600768.py:3: UserWarning: Category 'OR' skipped: need at least 3 data points for convex hull (got 1)
  convex_hull_plot(data=df_pca, x="PC1", y="PC2", hue="genus", palette="Paired", ax=ax)
/tmp/ipykernel_2862/3980600768.py:3: UserWarning: Category 'DE' skipped: need at least 3 data points for convex hull (got 1)
  convex_hull_plot(data=df_pca, x="PC1", y="PC2", hue="genus", palette="Paired", ax=ax)
<Axes: xlabel='PC1', ylabel='PC2'>
Filled hulls#
fig, ax = plt.subplots()
convex_hull_plot(
    data=df_pca, x="PC1", y="PC2", hue="genus",
    palette="Paired", fill=True, ax=ax,
)
sns.scatterplot(data=df_pca, x="PC1", y="PC2", hue="genus", palette="Paired", ax=ax, legend=False)
/tmp/ipykernel_2862/392337398.py:2: UserWarning: Category 'TO' skipped: need at least 3 data points for convex hull (got 1)
  convex_hull_plot(
/tmp/ipykernel_2862/392337398.py:2: UserWarning: Category 'OR' skipped: need at least 3 data points for convex hull (got 1)
  convex_hull_plot(
/tmp/ipykernel_2862/392337398.py:2: UserWarning: Category 'DE' skipped: need at least 3 data points for convex hull (got 1)
  convex_hull_plot(
<Axes: xlabel='PC1', ylabel='PC2'>
Combine with shape overlays#
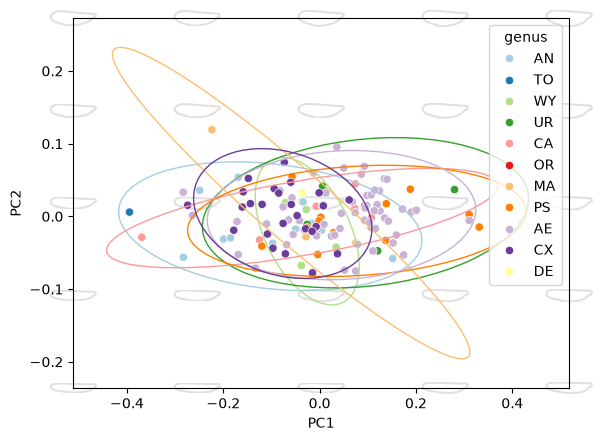
Draw scatter and ellipses first, expand the axis limits with
ax.margins(), then add shape overlays. This ensures the shapes
are placed over the expanded range:
fig, ax = plt.subplots()
sns.scatterplot(
    data=df_pca, x="PC1", y="PC2", hue="genus", palette="Paired", ax=ax,
)
confidence_ellipse_plot(
    data=df_pca, x="PC1", y="PC2", hue="genus",
    palette="Paired", legend=False, ax=ax,
)
ax.margins(0.1)
morphospace_plot(
    reducer=pca,
    descriptor=efa,
    components=(0, 1),
    n_shapes=5,
    shape_scale=0.5,
    ax=ax,
)
/tmp/ipykernel_2862/1203161487.py:5: UserWarning: Category 'TO' skipped: need at least 2 data points for confidence ellipse (got 1)
  confidence_ellipse_plot(
/tmp/ipykernel_2862/1203161487.py:5: UserWarning: Category 'OR' skipped: need at least 2 data points for confidence ellipse (got 1)
  confidence_ellipse_plot(
/tmp/ipykernel_2862/1203161487.py:5: UserWarning: Category 'DE' skipped: need at least 2 data points for confidence ellipse (got 1)
  confidence_ellipse_plot(
<Axes: xlabel='PC1', ylabel='PC2'>
See also
Visualize Morphospace for scatter plots with shape overlays
Visualize Shape Variation for visualizing shape changes along component axes
Morphometric Visualization for the reconstruction pipeline design