
Draw TPS Deformation Grid#
Visualize shape deformation using thin plate spline grids.
Basic TPS grid#
import numpy as np
import matplotlib.pyplot as plt
from ktch.plot import tps_grid_2d_plot

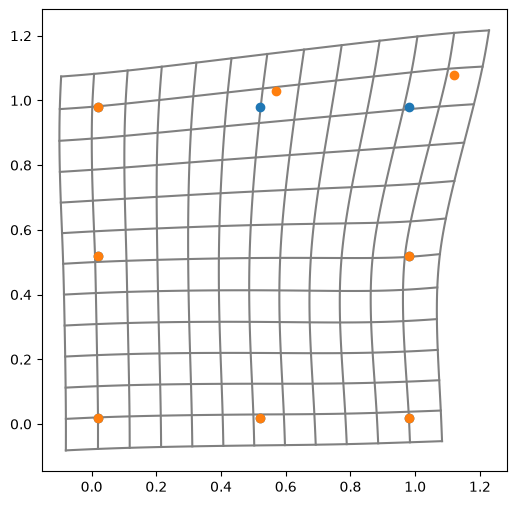
# Reference shape: unit square with corner and edge landmarks
# Use slight offsets to avoid grid points coinciding with landmarks
reference = np.array([
    [0.02, 0.02], [0.98, 0.02], [0.98, 0.98], [0.02, 0.98],
    [0.52, 0.02], [0.98, 0.52], [0.52, 0.98], [0.02, 0.52],
], dtype=float)

# Target shape: slightly deformed
target = reference.copy()
target[2] = [1.12, 1.08]
target[6] = [0.57, 1.03]

fig, ax = plt.subplots(figsize=(6, 6))
tps_grid_2d_plot(reference, target, grid_size=0.1, ax=ax)
ax.set_aspect('equal')
plt.show()
Customize grid extent and smoothness#
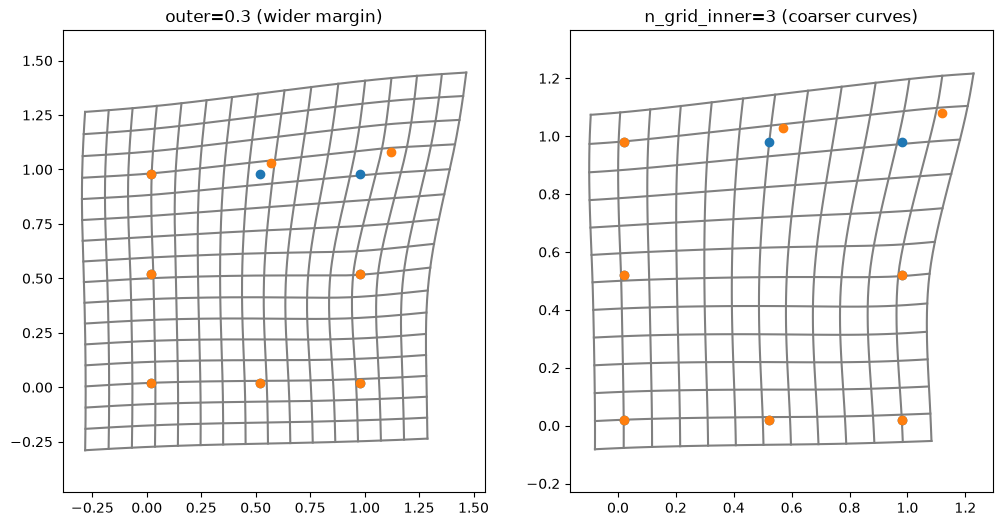
outer controls how far the grid extends beyond the landmark bounding
box as a fraction of the span (default: 0.1 = 10 %).
n_grid_inner controls the number of interpolation points between
grid lines, affecting visual smoothness (default: 10).
fig, axes = plt.subplots(1, 2, figsize=(12, 6))

tps_grid_2d_plot(reference, target, grid_size=0.1, outer=0.3, ax=axes[0])
axes[0].set_aspect("equal")
axes[0].set_title("outer=0.3 (wider margin)")

tps_grid_2d_plot(reference, target, grid_size=0.1, n_grid_inner=3, ax=axes[1])
axes[1].set_aspect("equal")
axes[1].set_title("n_grid_inner=3 (coarser curves)")
Text(0.5, 1.0, 'n_grid_inner=3 (coarser curves)')
See also
Thin-plate spline for detailed examples